Abstract
"Swing me higher, Mommy, higher!" Kids love to ride the swings at the playground. The back-and-forth motion of a swing demonstrates the physics of a pendulum. In this experiment, you will investigate the factors that affect the speed and duration of a pendulum's swing, also called an oscillating motion. You can even use your phone and a sensor app to record your pendulum's movement and determine its period of oscillation.Summary
La Né Powers
Edited by Ben Finio, PhD, Science Buddies

Objective
Investigate the motion of a simple pendulum and determine how the motion of the pendulum is related to its length.
Introduction
A pendulum is an object, hung from a fixed point, that swings freely back and forth under the action of gravity. A playground swing (Figure 1) is an example of a pendulum. The swing is supported by chains that are attached to fixed points at the top of the swing set. When the swing is raised and released, it will move freely back and forth. These back and forth movements are called oscillations. The swing is moving due to the force of gravity on the swing. The swing continues moving back and forth until friction (between the air and the swing, and between the chains and the attachment points) slows it down and eventually stops it.

Figure 1. These playground swings are examples of pendulums.
We see pendulums in other areas of our lives as well, such as in long-case clocks, commonly known as grandfather clocks. But pendulums can do more than entertain and help us tell time. Among other applications, they can show that the Earth is rotating! This was done in the mid-1800s C.E. using perhaps the most famous pendulum, Foucault's pendulum. However, pendulums were being used for centuries before this. One of the first known pendulum uses was around 100 C.E., when a Chinese scientist, Zhang Heng, used it to detect distant earthquakes in a device called a seismometer. Today, pendulums have many applications, including measuring local gravity and helping guide ships and aircrafts.
In this science fair project, you will investigate how the period of a pendulum is related to the pendulum's length. A pendulum's period is the time it takes the pendulum to swing back to its original position. In the example of a kid being pushed in the swings at a playground, this is the time it takes the kid to be pushed and then return back for another push. The period of a pendulum is mathematically related to the pendulum's length.
Terms and Concepts
- Pendulum
- Gravity
- Oscillations
- Friction
- Foucault's pendulum
- Seismometer
- Pendulum period
- Accelerometer
- Acceleration
Questions
- What is a pendulum and what causes it to swing?
- What are some common uses for pendulums?
- How do you think the period of a pendulum is related to its length? Will a longer pendulum have a longer period than a shorter one?
Bibliography
- The University of Colorado at Boulder: PhET Interactive Simulations. (n.d.). Pendulum Lab. Retrieved February 27, 2012.
Introduction to General Physics Concepts:
- Hewitt, Paul G, 2002. "Conceptual Physics," Prentice Hall, IL.
Simple Physics Concepts for Kids:
- Keller, R.W., 2005. "Real Science for Kids: Physics, Level 1," Albuquerque, NM: Gravitas Publications, Inc.
Materials and Equipment
- String
- Scissors
- Ruler
- Desk or table
- Heavy textbook
- For option 2 in procedure:
- Large metal washer or other small, heavy object you can use as a weight.
- Stopwatch
- An assistant
- For option 1 in procedure: Smartphone with a sensor app such as phyphox, available for free on Google Play for Android devices (version 4.0 or newer) or from the App Store for iOS devices (iOS 9.0 or newer).
- Lab notebook
Experimental Procedure
Note: There are two different ways to do the experiment. In one method, you will attach your phone to the end of a string and use the accelerometer of your phone and a sensor app to create a graph of the phone's motion as it swings, then measure the pendulum's period based on the graph. In the other, you will tie washers to the end of a string to form a pendulum and use a stopwatch to measure its period as it swings.
- Place your ruler so it hangs off the edge of a desk or table, and weigh it down with a heavy book so it does not fall off.
- You will test pendulums of three different lengths. The exact lengths will depend on the height of your desk or table. For example, you could test lengths of 20, 40, and 60 centimeters (cm).
- Create a data table like Table 1 in your lab notebook.
| Period | ||||
|---|---|---|---|---|
| Pendulum length (cm) | Trial 1 | Trial 2 | Trial 3 | Average |
Option 1: Using a Sensor App
Sensor apps such as phyphox let you record data using sensors that are built into many smartphones, including an accelerometer which measures motion. Technically the accelerometer measures acceleration, or the change in velocity in meters per second squared (m/s2), but you do not need to worry about that for this experiment. In this project, you can use the app to record the motion of your pendulum, and then use the data to measure its period.
- Create your first pendulum, as shown in Figure 2.
- Cut a piece of string that is slightly longer than the first length you want to test (leave enough extra string to attach it at both ends).
- Tie one end of the string to the ruler. Weigh the ruler down with something heavy, like a textbook, so it hangs off the edge of a table or desk.
- Tape the back of your phone to the other end of the string. Make sure the phone is upright when the pendulum is hanging straight down (so the phone's long dimension, the Y-axis, is aligned with the string).
- Test your pendulum by pulling the phone to the side and releasing it. If the phone twists or wobbles a lot as it swings back and forth, this will affect your data. Try letting the phone rest lightly against a piece of posterboard or other smooth, flat, vertical surface. This will introduce some extra friction and slow the pendulum down a bit, but it will prevent the phone from twisting.
- Make sure that the final length of the string is correct. You might have to make an adjustment or re-attach the phone to get this right.
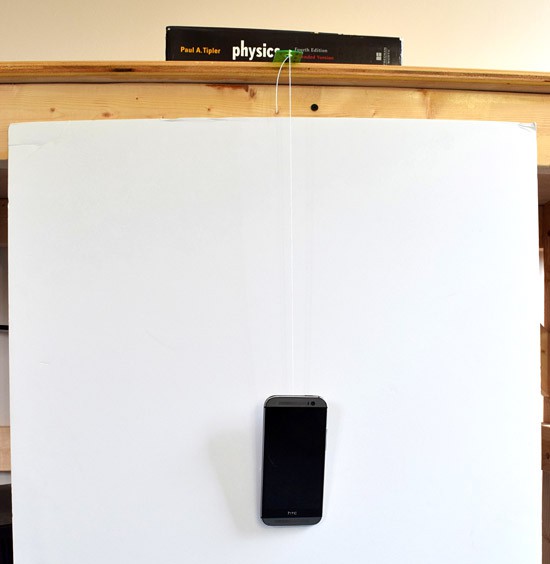 Image Credit: Ben Finio, Science Buddies / Science Buddies
Figure 2. Pendulum made with a ruler, string, and a phone.
- If you are using phyphox, open the acceleration with g sensor. Press on the Y accelerometer graph to enarge it.
- Pull the pendulum back about 30 degrees, press the play button within the app to start a recording, and let go of your phone.
- Let your pendulum swing back and forth until it comes to a stop.
- Grab your phone and hit the pause button to stop recording data. Make sure to save your experiment and give it an appropriate name.
- Your data should look something like the graph in Figure 3. Your graph should show oscillations as your phone swings back and forth. If there are any spiky parts at the end of the graph you can ignore these (this occurs when you grab the phone). Instead, zoom in on the part of the graph that shows clear oscillations (Figure 4).
- Measure the time between two adjacent peaks. In the phyphox app, use the 'pick data' tool to select the highest points of two adjacent peaks. Once you have picked a data point the app will display its x- and y-values. For example, the peaks in Figure 4 occur at 10.3 and 11 seconds, so the difference between them is 0.7 seconds.
- This value is half the period of oscillation of your pendulum. So, the pendulum in this experiment had a period of 1.4 second. This occurs because the pendulum moves back and forth (first in one direction, then the other) for one complete period; giving two peaks in the Y acceleration graph per swing of the pendulum's motion.
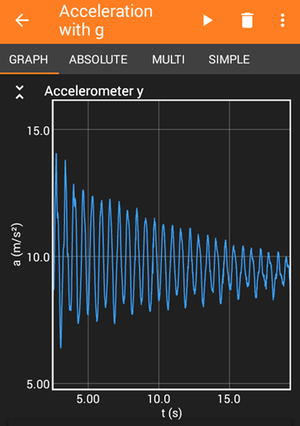 Image Credit: Science Buddies
Example graph showing acceleration over time of a smartphone that is swinging back and forth on a string. Each time the phone changes direction, the acceleration changes, leading to a zig-zag pattern. The minimum acceleration value is 6.4 and the maximum acceleration value is 14 meters per second squared.
Figure 3. Example data from the phyphox app. The x-axis of the graph shows time in seconds [s] and the y-axis is acceleration in meters per second squared [m/s2].
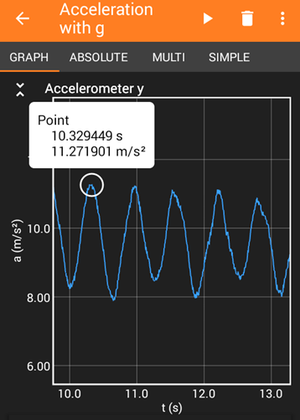 Image Credit: Science Buddies
Example graph showing acceleration over time of a smartphone that is swinging back and forth on a string. The minimum acceleration value is 7.9 and the maximum acceleration value is 11.3 meters per second squared. A marker is placed at the peak acceleration of 11.27 meters per second squared (10.3 seconds).
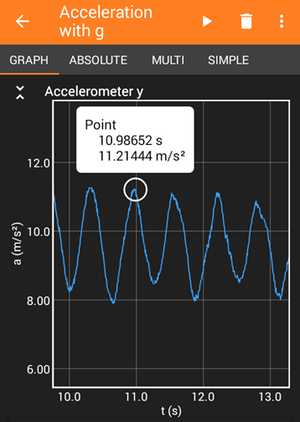 Image Credit: Science Buddies
An example graph shows acceleration over time for a pendulum. The graph oscillates up and down due to the acceleration changing direction as the pendulum changes direction. The minimum acceleration value is 7.9 and the maximum acceleration value is 11.3 meters per second squared.
Figure 4. How to measure the oscillation period from a graph in phyphox. The x-axes of the graphs show time in seconds [s] and the y-axes are acceleration in meters per second squared [m/s2].
- Repeat steps 3–8 two more times, for a total of three trials with your first pendulum length.
- Repeat steps 1–9 for your other pendulum lengths. Record all your results in your data table.
- For each pendulum length, calculate an average period. Do this by adding up the values for your three trials and dividing by three.
- Analyze your data.
- Use the Create a Graph website to create a graph of your data with pendulum length on the horizontal axis and average period on the vertical axis.
- How does the pendulum's period change with its length? Is this what you predicted?
- Does the period stay constant as the pendulum oscillates or does it change over time?
- What other information can you gather from the graph using a sensor app that you probably can not get just from using a stopwatch as described in option 2?
Option 2: Using Washers and a Stopwatch
- Create your first pendulum.
- Cut a piece of string that is slightly longer than the first length you want to test (leave enough extra string to tie knots at both ends).
- Tie one end of the string to the ruler.
- Tie a weight to the other end of your string. Make sure that the final length of the string (after you tie the knot) is correct. You might have to make an adjustment or re-tie the knot to get this right. Figure 5 shows a completed pendulum.
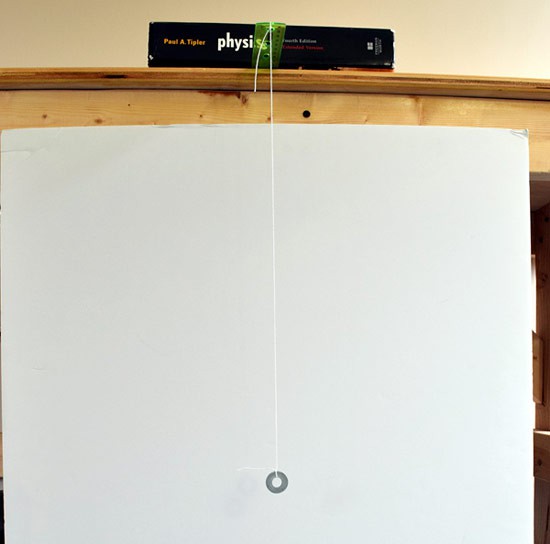 Image Credit: Ben Finio, Science Buddies / Science Buddies
Figure 5. An example pendulum experimental setup.
- Measure the period of your pendulum.
- Pull the weight of the pendulum back about 30 degrees. It is important to keep this angle the same for each trial.
- Have your volunteer get the stopwatch ready.
- Release the pendulum. Your volunteer should start the stopwatch as soon as you let go.
- Count out loud as the pendulum swings back and forth (the first time it returns to its original position, say "one," the next time say "two," etc.).
- Your volunteer should stop the stopwatch when you say "ten."
- Record the stopwatch value in your lab notebook. Divide this value by 10 to calculate the period of your pendulum (measuring over 10 periods like this is more accurate than trying to use the stopwatch to measure just one period).
- Repeat steps 2.a–2.e two more times, for a total of three trials with your first pendulum length.
- Repeat steps 1–2 for your other pendulum lengths. Record all your results in your data table.
- For each pendulum length, calculate an average period. Do this by adding up the values for your three trials and dividing by three.
- Analyze your data.
- Use the Create a Graph website to create a graph of your data with pendulum length on the horizontal axis and average period on the vertical axis.
- How does the pendulum's period change with its length? Is this what you predicted?
Ask an Expert
Variations
- Instead of changing the length of string, try changing the number of weights attached to the string. Does mass affect the speed of the swing or how long the pendulum swings?
- Try changing the initial angle of the string when you drop it. Does this affect the speed and duration of the swing?
- Try changing the size of the washers. Does this affect the speed and duration of the swing?
- For a more advanced challenge, you can calculate the expected periods of your pendulums using a mathematical equation. To do this, check out The California Academy of Sciences resource About Foucault Pendulums. For each pendulum, how does the average period you recorded compare to the expected calculated period? If they are different, why do you think this is?
Careers
If you like this project, you might enjoy exploring these related careers:

Related Links
- Science Fair Project Guide
- Other Ideas Like This
- Physics Project Ideas
- Science With Your Smartphone Project Ideas
- My Favorites